Blog
Not just what but how big: new impact information allows EIF Guidebook users to understand the scale of improvements from early intervention
Jack Martin, head of Guidebook at EIF, introduces the latest developments on the EIF Guidebook, our flagship resource for evidence-based information on early intervention programmes, which represent the most significant new additions since its conception five years ago.
In our last blog update on the EIF Guidebook – our tool to support commissioners and others to make the best possible decisions by providing access to the best available information about what works – we announced our ambition to add information on the impact of programmes: that is, on the scale of the improvements that they have generated for children and young people.
Over the last few years we’ve made a concerted effort to gather the views of our users about how to make the Guidebook as useful as we can. One message came through loud and clear: our users want this sort of information on impact and consider it a top priority. In response to this demand, we set about exploring the possible ways of adding this information, with a focus on finding a solution that would provide robust, trustworthy information, but also be accessible and user-friendly. After a long period of development, we are happy to say that this work is now complete, and new information about the size of impact achieved by early intervention programmes is now available on the Guidebook.
But why is this information important, what’s new and what does it mean, and how do we think this new information should be used?
Why is this information important?
The Guidebook has always listed the sorts of improvements that programmes have evidence of achieving, based on past evaluation studies. These child outcomes have been provided in the form of descriptive statements such as ‘Improved self-esteem’ or ‘Improved vocabulary’.
While this is clearly crucial information, something important was missing – namely, how much a given programme has improved an outcome, how big an improvement it achieved. In the examples above, how much did the programme improve self-esteem or vocabulary – by a little, or a lot?
We agree with our users’ feedback that understanding this scale of improvement is vital. It’s important that our users have a reasonable sense of what sorts of benefits they can expect when commissioning and implementing a programme. It’s also important that our users can compare similar programmes in terms of their track record of generating improvements, and in terms of cost-benefit, to help them select programmes that are a ‘best bet’ in terms of making a meaningful difference to the lives of children, young people and families.
What’s new, and what does it mean?
For a large number of programmes and their child outcomes, we now include new, important information on:
- the size of improvements as they were originally measured
- the relative size of improvements, using a comparable value called the improvement index score
- the time points at which these improvements were observed, including highlighting improvements that persisted over a longer period of time.
Improvements as they were originally measured
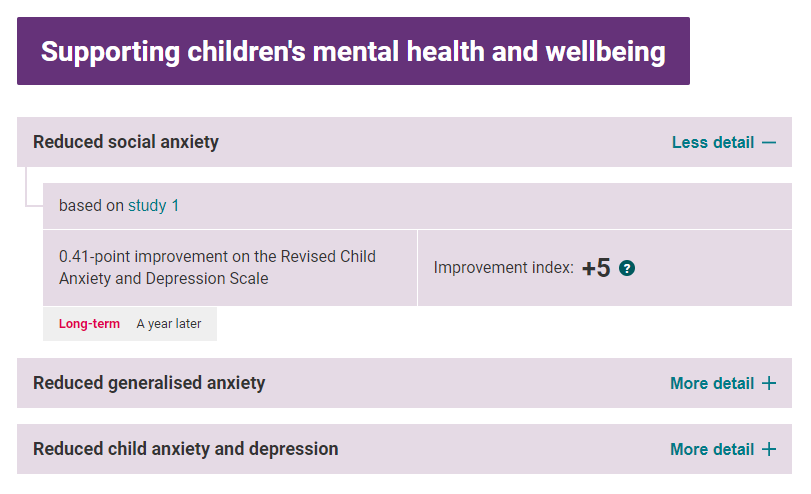
Our first step was to identify data on the size of improvements in child outcomes, on the same basis as they were originally measured in past evaluations. You can see this information on the left-hand side in the image above. This number describes the difference between the average outcomes of those who have received the programme, and the average outcomes for those who did not receive it. The difference between these outcomes is the improvement that we can attribute to the programme.
Other examples of this kind of information might be that a programme has achieved ‘a 20% reduction in smoking’ or ‘a 5-point improvement on the Problem Behaviour Scale’. We think this is useful information to report, because it tells us something useful about the nature of the improvement that a programme has generated: a 20% reduction in smoking is easy enough to understand at first glance, and we can learn what a 5-point improvement on the Problem Behaviour Scale means in practical terms, even if we are unfamiliar with the scale starting out.
However, we concluded this information was not enough on its own. Firstly, outcomes are often measured using scales that may be unfamiliar to many users, or difficult to interpret at first glance. These scales have been created by researchers for use in complex evaluations, and it would be time-consuming for most Guidebook users to become familiar with these scales and what they signify.
Secondly, there are problems with comparability. Effects described as they are originally measured will not always be directly comparable to one another. For example, child behaviour problems might be measured in one evaluation on a scale of 1–5 using the Problem Behaviour Scale, and in another evaluation on a scale of 1–12 using the Externalising Problems Inventory. A three-point change on one of these scales may mean something very different from a three-point change on the other scale, and it may be unclear, at first glance, which effect is actually larger or more meaningful.
Improvement index scores
Our second step, therefore, was to take this information and turn it into something more readily interpretable and comparable.
This is a common challenge. Researchers often report a number called an effect size. Effect sizes standardise information on the magnitude of effects, and so allow us to compare the relative size of improvements between one programme and another, or between different evaluations, even if they originally used different scales. Think back to the earlier example about behavioural improvements: converting these improvements into effect sizes can reveal that a 3-point change on the Problem Behaviour Scale observed in one evaluation, is – relatively speaking – larger than a 3-point change on the Externalising Problems Inventory observed in another. However, these effect sizes are often not everyday, easily understood numbers with an obvious interpretation for users to apply.
So we decided to convert these effect sizes into a number that is more straightforward to interpret, while retaining the benefit of enabling comparison. After consulting the literature and a number of advisory groups, we opted to present effects in terms of percentile growth – also known as percentile rank improvement or, as we have chosen to do on the Guidebook, an improvement index. This approach is identified as a useful way of describing effect sizes by a number of methodologists in the field, and is also used by colleagues at the What Works Clearinghouse for Education in the US, and the Best Evidence Encyclopaedia. You can see this information on the right-hand side in the image above.
Interpreting the improvement index scores
The improvement index score is a number between 0 and 50. This number can be interpreted as an estimate of how much we’d expect the average participant in the control group to improve if they had received the intervention, relative to other members of the control group.
Imagine if you ordered young people from lowest to highest – worst to best – on a certain outcome. The improvement index tells you how much that outcome for the average young person – the person in the middle of the line – would improve by if they had received the intervention. As the average person, they start off on the halfway line – the 50th percentile. The improvement index tells you, if they had received the intervention, would they move up into the top 25%, into the top 10%, or to the very top 1%. You can click on the question mark icon next to each improvement index score to find out what it means.
For example:
- An improvement index score of 25 means we would expect the average participant in the comparison group who did not receive the intervention (for whom 50% of their peers have better outcomes and 50% have worse outcomes) to improve to the point where they would have better outcomes than 75% of their peers, and worse outcomes than 25% of their peers, if they had received the intervention.
- An improvement index score of 50 means we would expect the average participant in the comparison group who did not receive the intervention to improve to the point where they would have better outcomes than 100% of their peers, and worse outcomes than 0% of their peers, if they had received the intervention. In other words, they would have the best very outcomes relative to their peers.
- An improvement index score of 0 means that there is no improvement. The average participant in the comparison group who did not receive the intervention would maintain this ranking if they had received the intervention.
In addition to this information, we are now more transparent about the time points at which these outcomes have been achieved (immediately after the intervention, three months after, one year after, two years after, and so on) and report these clearly alongside the impact data.
It is worth noting that we have decided to only publish information on the size of improvements for programmes that receive a strength of evidence rating of at least level 3. This is because we can be confident in these cases that there was a causal relationship between participation in the programme and improvements in outcomes, and that the evidence provides unbiased and trustworthy estimates of improvement in outcomes.
Further guidance on how to interpret and use these numbers can be found in our guidance on how to read the Guidebook, and our FAQs.
How should this new information be used?
We think this new information will be really helpful to Guidebook users. We believe it provides a useful way to compare programmes on their track record of producing meaningful benefits for children, young people, and families, and that it will help to make some of the difficult decisions about services and programmes less difficult.
However, it’s still the case that none of this is easy. It is still absolutely crucial to look beyond the headline numbers – such as a programme’s evidence rating or the improvement index scores of its outcomes – and to think carefully about the ‘fit’ of the evidence and whether it is relevant to your situation.
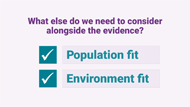
Even with this new information on impact, interpreting and comparing effects is not a straightforward matter. Nobody should compare programmes on the size of their effects alone, and simply select the one with the highest score. It is absolutely crucial to think about the context of your decision. Cost is an important consideration – a smaller effect from one intervention may be more desirable than a larger effect from another if it is achievable at a lower cost. Similarly, implementation is really important – a larger effect is perhaps less desirable if the programme is really difficult to implement properly compared to others. It’s also vitally important to consider target population – you may find that some programmes produce larger effects for a specific targeted group of people, but that others produce smaller effects at scale, among larger groups of people. All of these factors need to be carefully weighed when considering effects and choosing between interventions.
For all of these reasons, we recommend that our users don’t start with the size of impact when considering interventions. It is important to define which outcomes you wish to improve and for whom, and to establish what is feasible to implement in your situation. Once you’ve narrowed down the set of interventions on this basis, then it will be important to see which have a track record of producing larger improvements in the outcomes that you care about.
- For more information on how to balance this effect size information in your decision-making and what to look out for, please see our Guidebook FAQs.
As we wrote in 2019, this work is never finished. We seek to constantly improve how we communicate the evidence on improving outcomes for children with our users. Over the coming year, we look forward to hearing from our community of users and contributors on how useful and accessible they are finding this new information. More broadly, we will be acting on the findings of our recent research into how we can continue to improve the Guidebook, to make it the most useful tool it can possibly be, to make those difficult decisions less difficult, and help you to achieve real and meaningful change.